Total quality management tools
From Supply Chain Management Encyclopedia
Russian: Принципы бережливого производства
Overview
"Total Quality Management (TQM)" is an approach that focuses on continuous improvement of quality of products, operational processes, system of management through eliminating errors in manufacturing and supply chain optimization. TQM finally involves all departments and services in order to provide the overall quality of the product for customers. Contemporary TQM is a management approach to long–term success through customer satisfaction. This approach takes the beginning in early 50’s, when W. Edwards Deming worked in Japan as a management consultant. He trained engineers in quality processes. Deming believed that improvement in quality leads to lower costs because of fewer defects, less waste, fewer delays. Low cost can provide the company with additional market advantages. Deming called his philosophy "A system of Profound Knowledge". It consists of four parts:
- appreciation for a system, where system is a set of activities (functions) inside the organization boundaries that work together to achieve organizational goals;
- knowledge of the theory of variation, understanding, that variation exist in every production process due to different lots of materials, machine vibration, outside temperature and humidity and a lot of different factors. It’s impossible to remove variation, but is possible to separate natural sources of variation and unnatural patterns in variation in order to provide stable process;
- theory of knowledge, claiming that there is no knowledge without theory and the experience alone does not establish a theory. Just to copy the story of success without deep understanding the theory leads to failure;
- psychology, that helps to understand people, interaction between them.
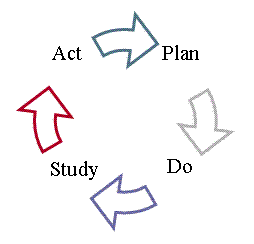
His work had a great impact on the Japanese manufacturing because Deming principles (well known as Deming’s Fourteen Points for Management) were widely adopted on all the levels of personnel in organizations. In 70’s this approach became widely spread based on the outstanding results received in Japan. The concept was enhanced by Joseph Juran and Kaoru Isikava and assumes an increasing emphasis on statistics, process improvement and optimization of the process.[1] Seven statistically based tools are used to gather and analyze data in Deming cycle:
These instruments are visual and simple for everyone to understand. They also provide good communication in organization both vertically and horizontally.
The seven basic quality tools
- Check sheet is the simple way to collect the data on regular basis. Present information in an efficient visual form and can be used by each employee. Quality-related data could be attribute and variable. Attribute (qualitative) data could be collected by counting events (number of defective items per shift or week, missed connections with the client), but variable by measurement on a continuous scale (weight, mileage, volume, etc.). For different data types different check sheets are used.
- Pareto chart is used to identify factors that have the greatest cumulative effect on the process. Pareto principle is used there: 80% defects are based on 20% of problems. It’s a vertical bar chart, where categories are shown in descending order of frequency. Also cumulative distribution visualization could be added as a line chart. Used when is necessary to focus on the most important problems (causes of problems with equipment, etc.).
- Flowchart is defined as a picture of the process that shows the sequence of steps performed. Usually flowcharts are developed by people involved in the process – workers, supervisors or managers, and they help them to understand the process better. Once constructed, a flowchart helps to identify quality problems and areas of improvement.
- Cause and effect diagram (Fishbone diagram, Isikava diagram). This diagram shows the cause of a certain event. At the end of the horizontal line is the problem to be addressed (sufficient numbers of defects per shift every Wednesday, etc.). Each offshoot shows the main stem representing a possible cause (personnel is tired and became less accurate, etc.). The diagram is often developing just before data collection in order to find possible sources of problems and gather data more professionally.
- Histogram is constructed by drawing rectangles for each class of data. The height of each rectangle is the frequency (relative frequency) of the class. It shows the number of items within a specified group. The shape of the distribution, range and spread of the data set could be easily seen using histograms.
- Scatter diagram (scatter plot) is the way to represent relationships between two variables (number of defective items per shift and number of problems with readjustment of equipment, etc.). It’s used only for numerical data, so one variable is plotted on the horizontal axis and the data of the second variable on the vertical axis. The point is plotted on the two-dimensional graph for each measurement (day, shift, or week). If points are clustered in some way, is possible to conclude, that variables of interest are related.
- Control chart is a central instrument of statistical process control, being base of TQM. Much of the Deming philosophy is based on the use of control chart to understand the nature of variation. It’s visually depicts the state of control of a process. This tool allows employees to identify quality problems when they occur and make a decision on hard facts.[2]
References
- ↑ James W. Dean, Jr., James R. Evans. Total Quality Management, Organization and Strategy. 2002. ISBN-10 9812400680
- ↑ Levine, David M., David F. Stephan, Timothy C. Krehbiel, and Mark L. Berenson (2011) Statistics for Managers Using Microsoft Excel. Sixth Edition. Pearson Education, Inc. ISBN: 0136113494]


