Net present value
From Supply Chain Management Encyclopedia
Net present value (NPV) is the worth in current monetary units of a time-based stream of incoming and outgoing cash flows.[1] A number of supply chain decisions can be evaluated using the NPV model. The terms in the model include the net cash flow (Ct) at each time period (generally a year), the initial investment (Co), and the discount rate (r). The discount rate is also called the rate of return, the hurdle rate, or opportunity cost of capital. If the NPV of an investment is positive, then the investment should be undertaken. If several alternatives exist, then the alternative with the highest NPV should be selected. Two applications of NPV are provided below (also see financial logistics for another example).
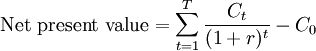
Where:
- Ct = net cash flow (inflow minus outflow) at time t
- Co = initial investment, if any
- r = the discount rate
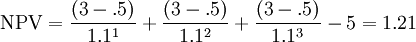
Example 1: An Investment that Reduces the Level of Inventory
Suppose the average replacement value of inventory (v) at a warehouse is €150 million and the inventory carrying cost rate (c) is 40%. The annual carrying cost = c x v =.40 = €60 million. A one-time software investment of €5 million and an ongoing cost of €.5 million (for training, minor upgrades) is estimated to reduce inventory by 5%. The software lifespan is 3 years, after which it becomes difficult to predict whether an additional major investment will be necessary. The required rate of return (r) equals 10%. The critical question is whether the investment is worthwhile. The NPV model may be applied to understand whether the software should be adopted. As seen in applying the NPV model, the initial investment at time zero (Co) equals €5 million. During the first year the inflow equals the savings generated by the reduced inventory level (annual inventory carrying cost x percentage reduction in inventory = €60 million x .05 = €3 million) minus the additional annual expense of the software (€.5 million) divided by the present value of the discount rate (1.1). The NPV of the investment equals €1.21 million and the investment is worthwhile since the NPV is greater than zero.
Example 2: Transportation Public Policy: The Case of a Monorail System
In 2002, a consulting company produced a report on the feasibility of 22.5 kilometer monorail project for the city of Seattle (United States) that would connect the city center to the city stadium district. An NPV analysis was applied to the problem. Benefits (or cash inflows) were expected in the form of ridership revenue and in the form of various user savings including travel time, parking, automobile operation, reliability, and reductions in bus- and auto-related accidents. The 22 year present value of benefits (or the cash inflow) was estimated at US $2.07 billion and of costs was estimated at US $1.67 billion. Based on a discount rate of 6%, the project NPV was evaluated at US $390. The implied rate of return, or the discount rate at which cost equals benefit (or an NPV of zero), was 7.95 percent. The report was criticized for not comparing the monorail plan with other alternatives including an expansion of highway capacity and the construction of a light rail system. Despite these shortcoming the monorail project moved ahead, but quickly ran into financial difficulties and public opposition. While construction was planned to begin in 2005 and end in 2009, the monorail project was shut down in 2008 when the Seattle Monorail Authority was dissolved.[2]
References
- ↑ Moyer, R.C., J.McGuigan and W. Kretlow (2006), Contemporary Financial Management, Mason, OH: South-Western Publishing.
- ↑ Transportation Benefit Cost Analysis (2011), http://bca.transportationeconomics.org/case-studies/monorail.