Time-varying demands
From Supply Chain Management Encyclopedia
Russian: Спрос, изменяющийся во времени
Consider situations where demand changes over time.[1] It also allows for time-varying purchase costs. Real demand rates and purchase costs do change, because of seasonal factors, or growing or shrinking markets, or other shifts in the economic landscape. The central managerial dilemma is to find the right balance between the cost of holding inventory and the cost of ordering, including scale economies. This issue is complicated here by temporal variations.
In practice, our current picture of future demand is a forecast. It is important to mention that the models of this chapter treat such forecasts as perfect. Demands change, but the changes are entirely predictable.
1. Extreme Cases
Consider a scenario like that of the basic economic order quantity in all respects but one: The demand rate is now a function of time, say  . The cost factors remain constant. The general case of this model is quite difficult. There are a few special cases, however, whose solutions can be described in simple terms, at least approximately. Understanding these special cases will help build our intuition about the overall effects of time-varying demands.
1.1 Small Changes
First, suppose the demand rate
changes over time, but only a little; there is some overall average demand rate  , and deviates from by only a few percent.
Since is almost constant, the EOQ model with constant demand rate is almost correct. If we use a constant order quantity  , the EOQ's cost function
  measures the actual cost quite accurately. Alternatively, if we use a constant cycle time
  is a good approximation. There is no compelling reason to consider radically different policies. In sum, EOQ model's optimal policy (
 or
or  ) should work well, and its optimal cost
  should accurately approximate the true optimal cost.
The EOQ model is robust with respect to demand-rate changes. That analysis concerned persistent changes, changes over all time. Here, the deviations are transient. If anything, we should expect the EOQ model to be more robust in this setting.
1.2 Fast Changes
The scenario above limits the demand fluctuations' amplitude. The next two cases restrict their frequency.
First, suppose fluctuates quickly around an overall average . Again, we define this condition loosely: For each  , let
, let  denote the average of
  over a small interval near . Call a fast-changing demand rate, if is nearly constant and equal to . The fluctuations may be large, but they are so rapid, the averaging process damps them out.
Next Figure shows what happens.

The demand-rate fluctuations cause only tiny ripples in  and hence in
  . Clearly, the EOQ model accurately measures the costs of alternative policies. Again, we can ignore the fluctuations and apply the EOQ model as is.
1.3 Slow Changes
Next, consider the opposite case: Suppose changes slowly. The idea, roughly, is that remain nearly constant over every plausible order interval. For instance, define

This is just the optimal order interval, computed for each as if the demand rate were constant at the current value . One way to define a slow-changing demand rate is to stipulate that change only a little over the interval  , for all .
Here is a plausible policy: Order only when stock would run out otherwise, and if is such a moment, order the quantity
(1) 
That is, use the EOQ formula, treating the demand rate as constant at its current value. Alternatively, order just enough to meet demand until  ().
().
Why should this heuristic work? Here is an intuitive argument: Consider a time period of intermediate length, covering several order cycles but no large shifts in and  . If really were constant, the EOQ model's optimal would nearly minimize the average cost over this period. Actually, does change, but only slightly, and each is near
  . So, the heuristic policy nearly minimizes the average cost over the period.
The basic idea is: The demand rate will change significantly only in the distant future, and we can ignore such changes in the current order cycle. (This is a myopic heuristic, one that focuses on the near future only. Such methods are effective in a variety of situations. We shall encounter them again later.)
The same reasoning suggests an approximation of the optimal average cost:

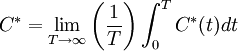
(Think of () as the approximate instantaneous cost rate. The integral can be evaluated exactly, of course, only for certain special forms of .
This model inherits the robustness properties of the EOQ model. For instance, and change only slightly in response to a modest change in  , and if the entire function doubles, each increases only by
  , as does . Moreover, is dynamically robust as well. That is, consider one fixed function . If changes modestly over some interval of time, then
For this reason, an even cruder heuristic works fairly well: Keep the order size (or the cycle time) constant most of the time. Change it only when (or  ()), as computed above, departs too far from the current policy. It is often easier to administer a policy whose variables change infrequently.
1.4 Discussion
To summarize: If the changes in are small and/or rapid, focus on the long-run average , ignoring the current demand rate. If evolves slowly, focus on the current and ignore longer-run changes.
We can even combine these three cases: Suppose is the sum of three functions, a small-, a fast-, and a slow-changing one. That is, suppose the local average does change over time, but only slowly. Following the arguments above, a reasonable heuristic policy is to set according to (1), using instead of .
This is still a rather extreme case. What about more typical cases, where includes changes of substantial size that are neither slow nor fast, but somewhere in between? The following crude guideline appears to work well: Suppose varies within a certain range. Compute the corresponding range of values for the EOQ formula, and set each order quantity within this range.
Of course, when the range of is wide, this guideline leaves a great deal of leeway. As discussed below, there seem to be no more precise, simple, reliable guidelines for finding a truly optimal or even close-to-optimal policy. Algorithmic methods, exact or approximate, appear to be essential.
1.5 A Finite Production Rate
Suppose there is a finite production rate  . Small or rapid changes in can again be ignored, following the arguments above. Consider a slow-changing demand rate. For simplicity, assume is continuous.
The simplest case is where  for all . The heuristic approach above can be adapted directly: Define
  , and redefine
(2) ![\, q(t)=\sqrt{\frac{2k\lambda (t)}{h[1-\rho (t)]}}](/images/math/2/8/5/2853606ec833b3feb303ef156f776509.png) .
.
Arguing as in Section 1.3, the policy using the as batch sizes will likely perform reasonably well. (This formula presumes that stock produced can be used immediately to meet demand. Otherwise, revise it, replacing  by
by  )
)
This approach will not work, obviously, when  for some . In that case, demand exceeds capacity, at least in the short run, and we must somehow anticipate such heavy-load periods. Next Figure illustrates the situation.

The horizontal line represents the capacity , and the curve is (The notation will be explained in a moment.)
Let  denote the cumulative demand. Feasibility requires
  for all . Suppose there is a finite time
  , such that
  for
for  . There are no capacity shortages after and we can apply (2) as above; the difficulties come before . Choose as small as possible. By continuity,
  , and for below but near and

Reducing further, this inequality certainly holds as long as , and it continues to hold for a while even when falls below .
At some point, however, cumulative supply catches up with cumulative demand, and

Set  to be the largest
  satisfying this equation. Thus, if we should arrive at time with no inventory, we must produce continuously at least until . The lightly shaded area in previous Figure is the total excess demand before , which must be anticipated by earlier production, and is the point where the darker area equals the light one.
Clearly,  . For the moment, suppose for all
  , as in the previous Figure.In this case the original heuristic fails only during the interval
 ![\,[t_{-} ,t_{+} ]](/images/math/9/4/b/94b55ed5c4c6cb5245c800beb2822ba8.png) .
.
This suggests the following modified heuristic: Apply (2) until  , then produce continuously until , (Minor adjustments may be needed to hook up the long production run in with the short ones before and after.)
Conversely, suppose that some  has . Thus, at some time before , the situation looks just like Figure. So, repeat the same approach: Identify a new , and schedule production around it in the same way.
Continue in this manner to identify such intervals, each requiring a relatively long production cycle to compensate for its short-term capacity shortage. Outside these intervals, apply (2) as above. (This procedure, like everything else in this section, is a heuristic.)
The broad effect of these extended production cycles on performance is clear: The early part of each cycle builds up inventory in order to meet demand in the later part when demand is heaviest. Thus, we end up holding larger inventories than we would otherwise.
The same ideas cover situations where the production rate also changes over time. i.e.,  . One special case deserves mention, where
  is proportional to , so
  is the constant
  .
.
Here, capacity expands and contracts in direct response to demand variations. Equation (2) reduces to

As in the uncapacitated model, varies as the square root of .
This discussion covers extreme cases only.
The general case requires intricate computational methods.
2. The Dynamic Economic Lotsize Model
2.1 Discrete-Time Formulation
This section formulates and analyzes an analogue of the EOQ model, where the demand and the purchase cost can vary over time in any manner.
To attain this level of generality introduce a very different conception of time. We model time as a finite sequence of discrete time points. We casually refer to time periods, the intervals between the time points, but in this view of the world all the significant events occur precisely at the time points themselves.
The problem, is the following: Demand for a product occurs at each of several time points. We must meet all demand as it occurs; no backorders or lost sales are permitted. We can order or produce supplies at each point, and we can carry inventory from one point to the next. Replenishment decisions take effect immediately; there is no order leadtime.
Each order incurs a fixed cost regardless of the size of the order, and also a variable cost proportional to the order quantity. There is a cost to hold inventory between any two successive points. These costs as well as the demands may change over time. The goal is to determine a feasible ordering plan which minimizes the total cost over all time points.
To formulate this problem, denote
 = time horizon
 index for time points,
The horizon is finite. Time period is the time from point until just before  . The data of the problem include
 demand at time
These are arbitrary nonnegative constants. The decision variables are
 inventory at time
 = order size at time
The starting inventory at time  is the known constant
  .
.
We use the notation  instead of to emphasize that demand occurs in discrete chunks, not continuously. Also, we use for the order size, not .
We reserve to describe a policy, indicating the amount to order if certain conditions are met, whereas specifies precisely what to order with no conditions attached. This is the most common usage in the literature on discrete-time models, perhaps because
looks more like a decision variable than .For similar reasons we denote inventory by  instead of .
The precise sequence of events at each time point  is as follows:
1. We observe the inventory .
2. We decide the order size .
Then, sometime during period , the order arrives and the demand occurs. We don't care precisely when these events happen, provided they are complete by the end of the period, in time to determine  at point .
The story concludes at step 1 of the last time point ; the terminal inventory is important, but there is no order or demand at the horizon.
The cost parameters are the following:
 fixed order cost at time
 variable order cost at time
 inventory holding cost at time .
These are all nonnegative. Let  denote the Heaviside function, that is,
  for
for  , and
, and  for
for  . The total order cost at time is thus
  . The holding cost at is
  . We ignore the constant cost
  , but we do include the terminal holding cost
  .
.
The model
Initial conditions:
(3) 
Dynamics
(4) 
Constraints:

(5) 
Objective function:
Minimize
(6) ![\, \sum _{t=0}^{T-1}[k(t)\delta (z(t))+c(t)z(t)]+\sum _{t=1}^{T}h(t)x(t)](/images/math/1/f/4/1f433a7070e5ee41ffc0e56ff03ef974.png)
This optimization problem is called the dynamic economic lotsize DEL model. It is also called the Wagner-Whitin problem after its inventors, Wagner and Whitin [1958].
Here is some additional notation, used below:
- cumulative demand through time ,

 - demand from time through

 - variable cost to order a unit at and hold it until .

The DEL model can be reformulated to eliminate the nonlinear function  from the objective by introducing additional binary indicator variables
  . Here, is 1 if we order at time , and 0 if not. (If you are familiar with integer programming, you will recognize this as a standard trick.)
The model requires some new constraints in addition to (5),


and the objective (6) now becomes linear:
Minimize
(7) ![\,\sum _{t=0}^{T-1}[k(t)v(z(t))+c(t)z(t)]+\sum _{t=1}^{T}h(t)x(t)](/images/math/3/1/c/31c019b8fc386395fcb59132d9acab15.png)
Thus, the DEL model can be expressed as a linear mixed-integer program.
2.2 The Linear-Cost Case
The linear-cost case, where all the  , is easy to solve, and the solution is interesting.
First, suppose that all the  equal some constant
  . The solution is obvious: Assuming
  , set each
  and
and  . Likewise, if
  , order nothing until the initial stock runs out, and from then on order the minimal amount required to keep
  .
.
In general, order as little and as late as possible, while still meeting demand as it occurs. This is the discrete-time version of a perfect flow system - it meets all demands while holding no inventory (except any remaining from the initial stock).
Now, suppose the variable costs do depend on . The basic economic issue here is the balance of purchase and holding costs: We can avoid projected cost increases by ordering earlier than necessary, but then we incur holding costs.
Assume for now. Consider any time and any single unit of demand within . To fill that demand unit, we can order a unit at any time  .If we choose time
  , the total cost is just
  .
.
This includes both the purchase cost  and the holding costs between and . To minimize this cost, compute
(8) 
Let  denote the largest achieving this minimum.
This calculation applies to all the demand units in . Thus, to solve the overall problem, we need only determine the best order time to meet time 's demand, separately for each . These optimal order times are independent of the demand quantities ; they depend solely on the cost factors.
The following recursive scheme streamlines the calculation:
(9) 

That is, there are only two possible values for  : If the first quantity in brackets is smaller, then
  , while if the second is smaller, then
  . For each
  , (9) requires the smaller of two numbers instead of the in in (8). Also, in (9) there is no need to compute the in advance. If we do order at some time , we order enough to meet demand at several consecutive time points (those
  for which
  ). (This latter property holds for positive
  too, as we shall see shortly.)
When , calculate the as above. Not all of these times represent actual orders, however. Use the initial inventory to meet demands until it runs out, thus replacing some of the earliest orders.
Incidentally, when  , we say there is a speculative motive for holding inventory, for this means we anticipate an increase in the purchase cost from period to , large enough to offset the intervening holding costs. If on the other hand
  for all , as in the case of constant
  (), we say the problem offers no speculation opportunities. This latter case is important, even when there are additional complexities like fixed costs.
2.3 The Zero-Inventory Property
The general DEL model with positive , as formulated above, is a hard-to-solve nonlinear program or an equally hard linear mixed-integer program. The model possesses a remarkable property, however, which we shall exploit later to devise a simple solution procedure.
Given a feasible solution, call an order time if  . The central result describes the optimal schedule in terms of the optimal order times, and is called the zero-inventory property.
It is simplest to state assuming : Orders should be planned so as to run out of stock just as each order is received. This rule works in the general case  too, with a slight qualification: The first order may arrive when there is positive inventory, but only the first. Here is a formal statement:
THEOREM There exists an optimal solution  to equations (3) to (6) such that
  only when
  , for every except possibly the earliest order time.
The theorem asserts that this property continues to hold even with nonstationary data.
The zero-inventory property implies that, at each order time, we order precisely the amount needed to cover demand until the next order time. In particular, the order times completely determine the order quantities. This point is crucial for the reformulation of the next subsection. (Also, assuming  , when the are all integers, so are the
  . This fact is useful: Sometimes it is important that the be integral, though the DEL model itself contains no such restrictions. It doesn't need them; they hold automatically. This is even true, it turns out, when
  is positive but integral.)
Incidentally, there is another way to demonstrate the zero-inventory property: The objective is a concave function of the variables over the convex set defined by the constraints and the dynamics. Its minimum can be found, therefore, at an extreme point of the feasible region. It is possible to show that every extreme point has the zero-inventory property, so the optimal solution does too. We shall not pursue this approach here, but it is worth being aware of it. Several extensions of the DEL model can be analyzed in this way.
2.4 Network Representation and Solution
To solve the DEL model, then, the primary problem is to select the order times. Focus on the case $x_{0} =0$. This selection problem can be expressed in terms of a network: The nodes correspond to the time points = 0, . . . , . There is a directed arc from to \textit{и }for every node pair (\textit{t, u}) with \textit{t $<$ u. }Any specific choice of order times corresponds to a\textit{ path }in this network from node 0 to node \textit{T, }and vice versa. The nodes encountered along the path (excluding itself) identify the order times.
Now, consider any one path and a particular arc  along the path. Choosing this arc means that is an order time, and we order just enough at to meet the demands at points through . Let
  denote the total cost incurred by this decision. The dynamics imply that
  , and
, and  for
for  . Thus,
(10) 
Now add the over all arcs encountered on the path. This sum accounts for the all costs in all periods - it is the cost of choosing the order times along the path.
So, compute for every arc in the network, and think of as the travel cost along arc . To determine an optimal sequence of order times, find a path of minimum total cost. In sum, the DEL model reduces to a shortest-path calculation. There are very efficient solution procedures for such problems. (See Gallo and Pallottino [1986], for example.) This network is acyclic (there is no path from a node to itself), and the nodes are naturally ordered by , which makes the calculation even easier.
Let us look at one method in detail. It is called forward recursion. The idea is to compute the minimum-cost path from node 0 to every node , starting with  , then
  and continuing until
  . This method solves the DEL model with horizon for each . Let
  denote the optimal cost of the -horizon problem, so is the optimal cost of the original DEL model.
Step aims to determine the last order time in the r-horizon problem, denoted  . But, assuming
  for some fixed
  , we should set all earlier order times according to the optimal solution of the -horizon problem, so the total cost is
  . To find the best such , the actual , compute the smallest of the
  . The following algorithm embodies this idea:
Algorithm Forward_DEL:
Set 
For  :
:

 largest achieving this minimum.
Once this calculation is done, recover the optimal order times by tracing the back from . That is, is the last order time,  is the next to last, and so on.
References
- ↑ Zipkin P. (2000) Foundations of inventory management; The McGraw-Hill Companies, Inc.